Contents
close all, clear all
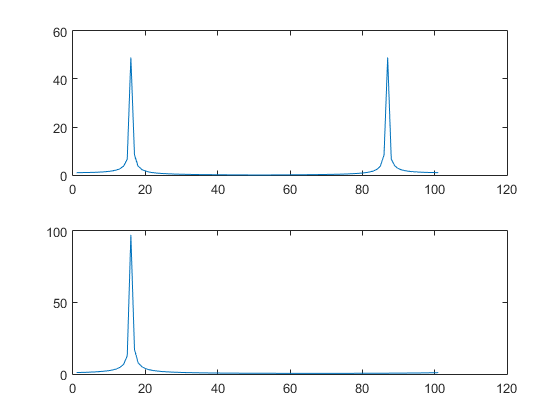
Real signal (cosine) and complex signal (exponential)
ts = .01;
t = 0:ts:1;

f0 = 15;

x1 = cos(2*pi*f0*t);
x2 = exp(sqrt(-1)*2*pi*f0*t);

y1 = fft(x1);
y2 = fft(x2);

figure(1)
subplot(2,1,1)
plot(abs(y1))
subplot(2,1,2)
plot(abs(y2))

stop = 1, pause
stop =

     1
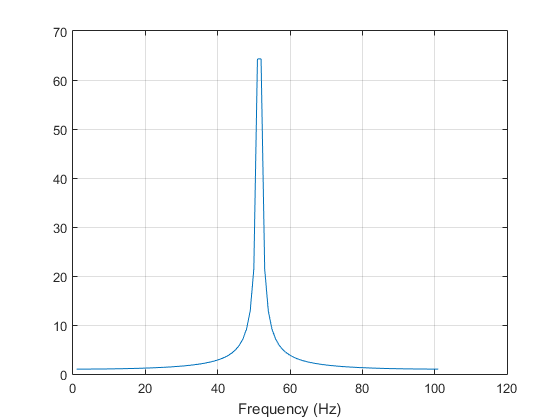
Swept sine wave
for f1 = 1:150
    x3 = cos(2*pi*f1*t);
    y3 = fft(x3);
    figure(2)
    plot(abs(y3))
    xlabel('Frequency (Hz)')
    grid on
    pause
end