Contents
Convolution Demo
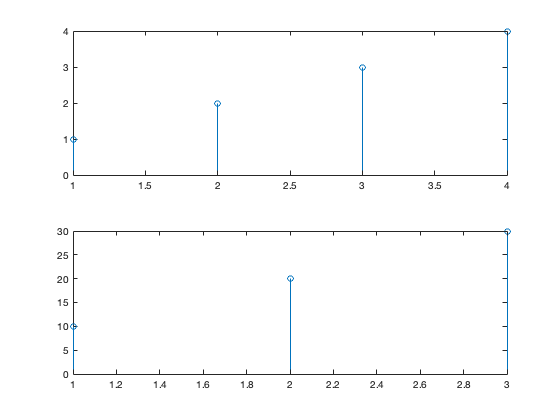
a = [1 2 3 4];
b = [10 20 30];
figure(1)
clf
subplot(2,1,1)
stem(a)
subplot(2,1,2)
stem(b)
c = conv(a,b)
figure(2)
clf
stem(c)
A = rand(3);
B = rand(4);
Cfull = conv2(A,B)
Csame = conv2(A,B,'same')
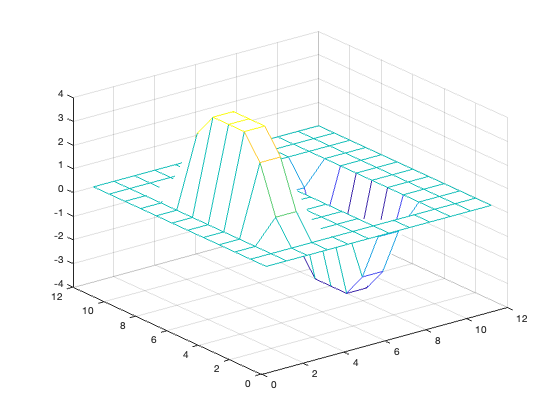
A = zeros(10);
A(3:7,3:7) = ones(5);
figure(3)
mesh(A)
u = [1 0 -1]';
v = [1 2 1];
Ch = conv2(u,v,A);
figure(4)
mesh(Ch)
Cv = conv2(v,u,A);
figure(5)
mesh(Cv)
c =

    10    40   100   160   170   120


Cfull =

    0.3385    0.9611    1.3067    1.0723    0.5843    0.2634
    0.4803    1.2465    2.0005    1.7586    1.4703    0.5546
    0.8451    1.7992    2.4580    2.8452    2.1226    0.9366
    0.9242    0.9729    2.3392    1.8331    2.1825    1.1621
    0.4131    0.5061    1.4741    0.7881    1.3500    0.7462
    0.3538    0.2067    0.4962    0.7152    0.1573    0.6391


Csame =

    2.4580    2.8452    2.1226
    2.3392    1.8331    2.1825
    1.4741    0.7881    1.3500


Correlation Demo
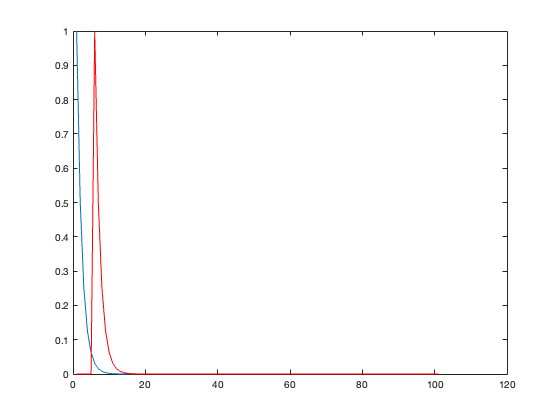
n = 0:100;
x = 0.5.^n;
y = circshift(x,5);

figure(6)
plot(x)
hold on
plot(y,'r')

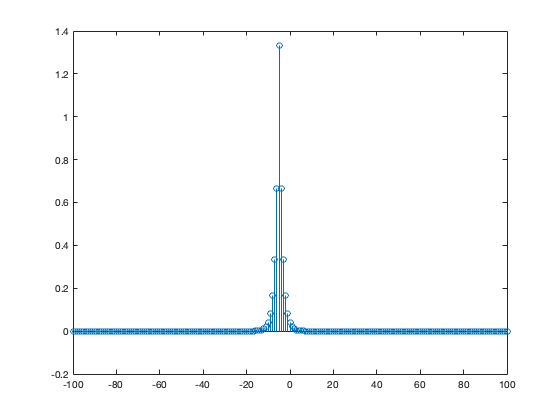
[c,lags] = xcorr(x,y);
figure(7)
stem(lags,c)

w1 = randn(100,1);
w2 = randn(100,1);
[c,lags] = xcorr(w1,w2);
figure(8)
stem(lags,c)

w1 = randn(100,1);
[c,lags] = xcorr(w1,w1);
figure(9)
stem(lags,c)

figure(10)
plot(conv(w1,w1(end:-1:1)))


