Contents
clear all, close all

t = 0:1/1024:1;
t = t(1:1024);

f = 0:1023;
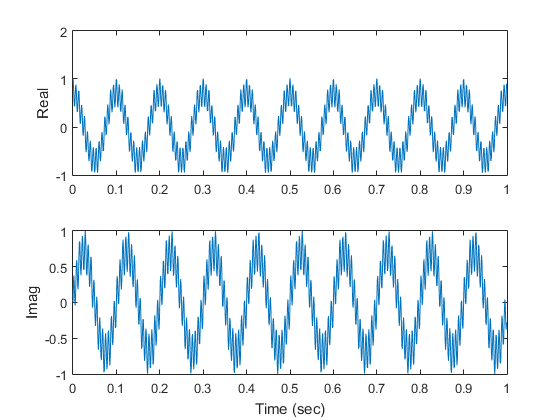
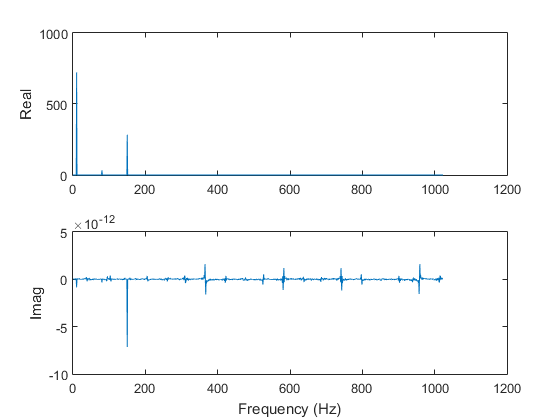
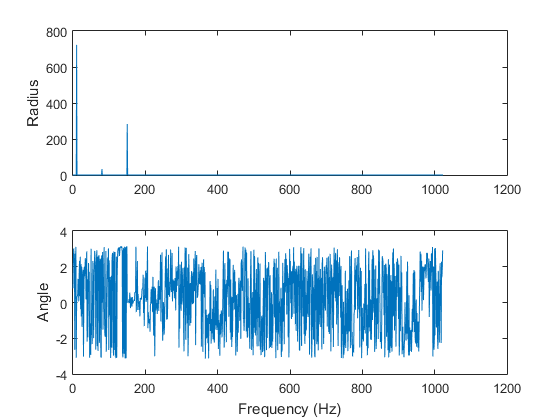
The first example is a signal that contains three harmonics.
Write the code that does the discrete Fourier transform.
Compare your frequency-domain results with the ones generated from MATLAB function fft.
f1 = 10; f2 = 80; f3 = 150;

x1 = rand(1)*exp(sqrt(-1)*2*pi*f1*t) + rand(1)*exp(sqrt(-1)*2*pi*f2*t) + rand(1)*exp(sqrt(-1)*2*pi*f3*t);

y1 = fft(x1);

figure(1)
subplot(2,1,1)
plot(t,real(x1))
ylabel('Real')
subplot(2,1,2)
plot(t,imag(x1))
ylabel('Imag')
xlabel('Time (sec)')

figure(2)
subplot(2,1,1)
plot(f,real(y1))
ylabel('Real')
subplot(2,1,2)
plot(f,imag(y1))
ylabel('Imag')
xlabel('Frequency (Hz)')

figure(3)
subplot(2,1,1)
plot(f,abs(y1))
ylabel('Radius')
subplot(2,1,2)
plot(f,angle(y1))
ylabel('Angle')
xlabel('Frequency (Hz)')
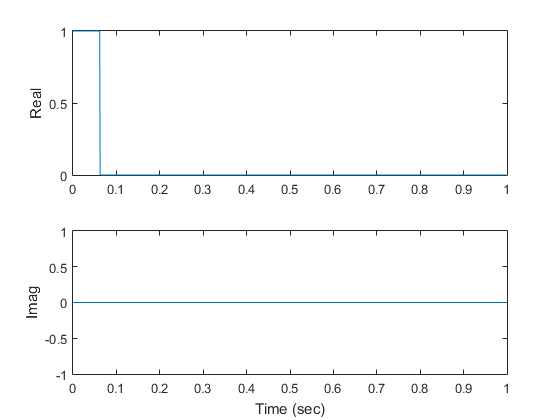
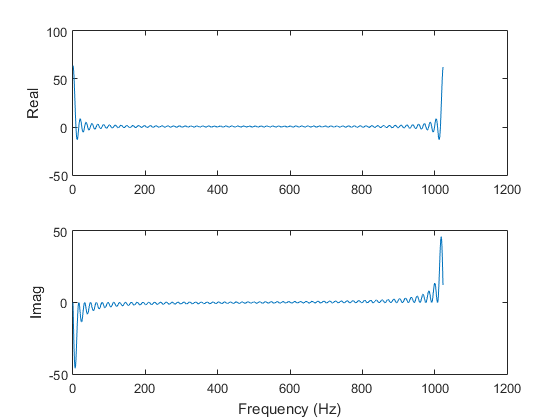
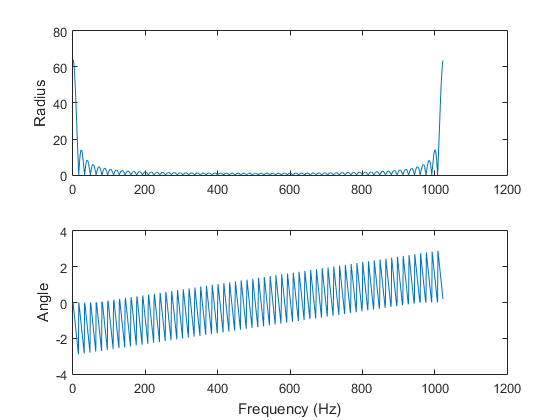
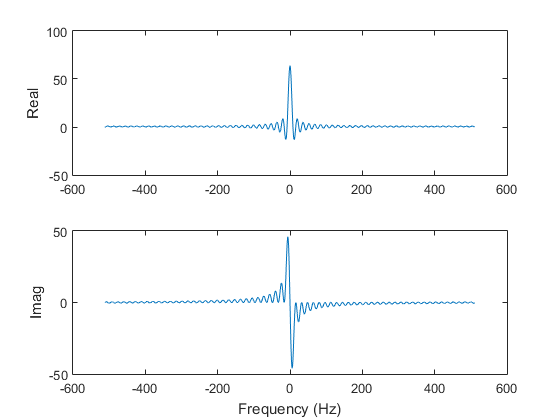
The second example is a rectangular (box) function. Therefore, its Fourier transform is a sinc function.
Write the code that does the discrete Fourier transform.
Compare your frequency-domain results with the ones generated from MATLAB function fft.
x2 = [ones(64,1); zeros(960,1)];
y2 = fft(x2);

figure(4)
subplot(2,1,1)
plot(t,real(x2))
ylabel('Real')
subplot(2,1,2)
plot(t,imag(x2))
ylabel('Imag')
xlabel('Time (sec)')

figure(5)
subplot(2,1,1)
plot(f,real(y2))
ylabel('Real')
subplot(2,1,2)
plot(f,imag(y2))
ylabel('Imag')
xlabel('Frequency (Hz)')

figure(6)
subplot(2,1,1)
plot(f,abs(y2))
ylabel('Radius')
subplot(2,1,2)
plot(f,angle(y2))
ylabel('Angle')
xlabel('Frequency (Hz)')


f2 = f - 512;

figure(7)
subplot(2,1,1)
plot(f2,real(fftshift(y2)))
ylabel('Real')
subplot(2,1,2)
plot(f2,imag(fftshift(y2)))
ylabel('Imag')
xlabel('Frequency (Hz)')

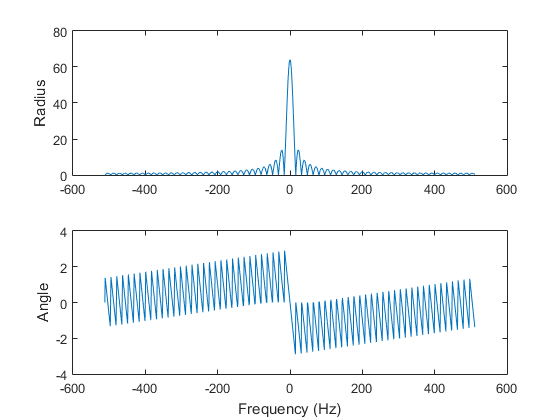
figure(8)
subplot(2,1,1)
plot(f2,abs(fftshift(y2)))
ylabel('Radius')
subplot(2,1,2)
plot(f2,angle(fftshift(y2)))
ylabel('Angle')
xlabel('Frequency (Hz)')
